A website that grew into a full analytics portal.
Vindeca Health first came to us for the web — a clean, credible presence for a healthcare brand. As we understood their business, the brief expanded. What they really needed was a decision-making tool: a secure portal where their teams could see, at a glance, how care is delivered, where drugs and resources are used, and how physicians perform across a large, messy dataset.
We designed the whole experience in Figma and are building it as a full-stack platform in React, Node, and MongoDB. It's an ongoing engagement — the surface area is large and still growing — but the shape is clear: turn dense healthcare data into modules people can actually read and act on.
Enormous data, tight cognitive budget.
Healthcare analytics lives or dies on trust and legibility. The portal has to hold an enormous amount of information — utilisation trends, medication patterns, physician-level performance — and still let a user find the one number that changes a decision. Too little detail and it's useless; too much and it's noise.
The core challenge was structuring several heavy, data-dense modules so each one has a clear job, a consistent visual language, and performance that holds up as the datasets scale. Every chart, table, and filter had to earn its place on the screen.
Design the system, then fill the modules.
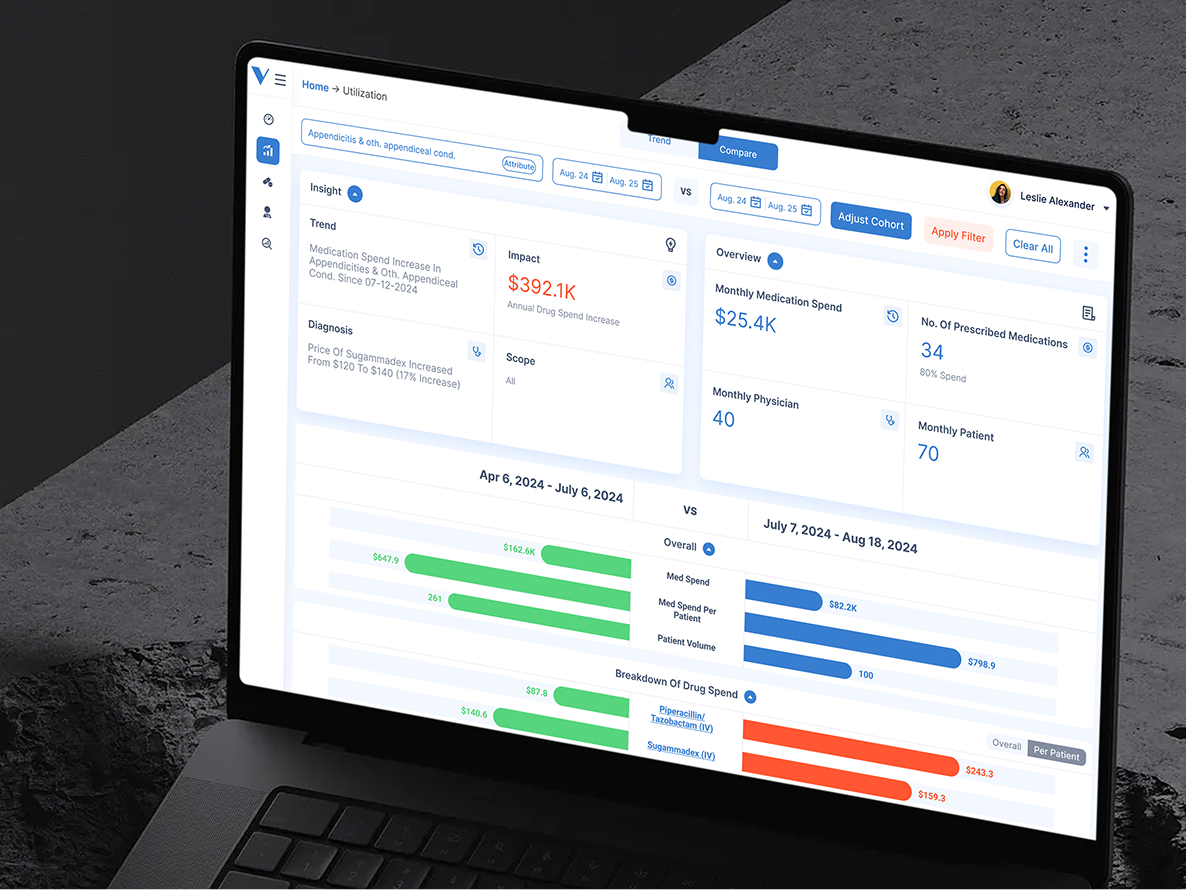
One design language for data — we built a Figma system of charts, tables, KPI tiles, and filters first, so every module reads the same way and nothing has to be reinvented per screen.
Modules with clear jobs — the portal is organised into distinct, purpose-built sections rather than one endless dashboard, so each answers a specific question about care and cost.
Built to scale — a React front end talking to a Node and MongoDB backend, structured so new metrics and modules can be added without destabilising what's already shipped.
Four heavy modules, one coherent portal.
Overview — the top-level pulse of the organisation. Headline KPIs and trends give leadership an immediate read on performance before they drill into any single area.
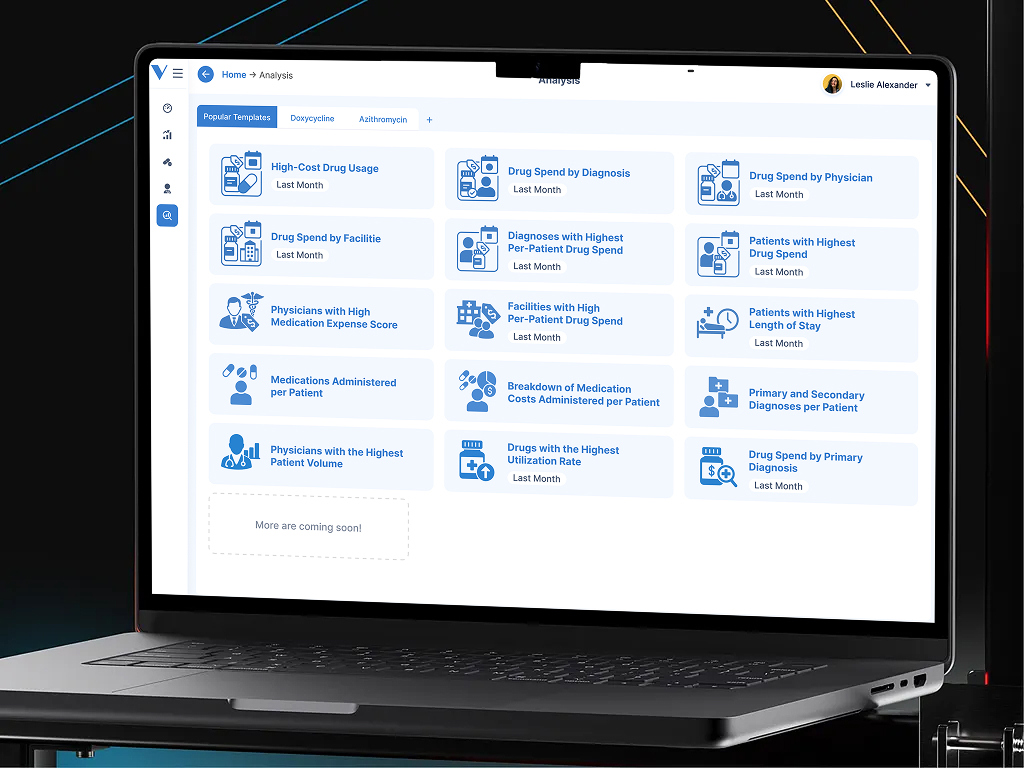
Utilisation — a deep view of how care, resources, and capacity are actually being used, surfacing patterns and outliers across the population and over time.
Medication Strategy — analytics focused on prescribing and medication patterns, built to support smarter, evidence-led decisions on therapy and cost.
Physician Analytics — performance and behaviour at the physician level, turning a sprawling dataset into fair, comparable, and actionable insight.
React, Node, and MongoDB.
The front end is a React application built around a reusable analytics component library — charts, data tables, filters, and KPI tiles that behave consistently across every module. A Node.js backend handles the API layer, aggregation, and access control, while MongoDB stores the flexible, evolving healthcare datasets the platform is built on.
Because the modules share both a design system and a data layer, the platform scales cleanly: a new metric or an entirely new module slots into established patterns rather than becoming a bespoke build each time.
Live, growing, and in active development.
Vindeca Health has a design-led portal that makes heavy healthcare data approachable — a clear Overview, and deep Utilisation, Medication Strategy, and Physician Analytics modules built on a stack that's ready to grow. The public site sits at vindecahealth.com.
This is an ongoing engagement. We're continuing to expand the modules, sharpen the analytics, and scale the platform alongside the Vindeca team as their data and needs evolve.
Project Gallery